MP Algorithm
Task: create FCM based on a bunch of data (for classification purposes)
It is attractive for the researchers to choose FCMs for classification tasks, over other popular tools such as neural networks. FCMs are easily explainable, which is a great advantage over black box models and, in many cases, equally accurate. The output of the algorithm is a fully connected FCM containing features nodes and class nodes) but the former produces numerical outputs while the latter produces nominal outputs (decision classes). In LTCN-MP algorithm (i) input variables are located in the inner layer and output variables in the outer layer, (ii) weights connecting the inputs are computed in an unsupervised way by solving a least squared problem, and (iii) weights connecting inputs with outputs are computed using the Moore-Penrose pseudo-inverse For more information about the algorithm, please check out
Deterministic learning of hybrid Fuzzy Cognitive Maps and network reduction approaches Gonzalo Napoles, Agnieszka Jastrzebska Carlos Mosquera Koen Vanhoof Wladyslaw Homenda
import os
# Defining the files we are going to use for creating FCMs. MP algorithm allows us create FCMs for each file located in the directory at the same time

sources = []
for filename in os.listdir(path='fcmpy/data'):
    if filename[-4:] == 'arff':
        sources.append('fcmpy/data/'+filename)

print(sources)
import fcmpy.ml.classification.FCM_MP as mp
params = {'L':0, 'M':1,
              # The only necessary parameter is source of the .arff files, other are optional
              'T':None, 'b1':1.0, 'folds':10,
          'output':'./output.csv', 'p':[1.0, 1.0, 1.0, 1.0],
          'rule':0, 'sources':sources, 'verbose':False}
          # Running algorithm and saving results to variable out
          out = mp.run(**params)
import matplotlib
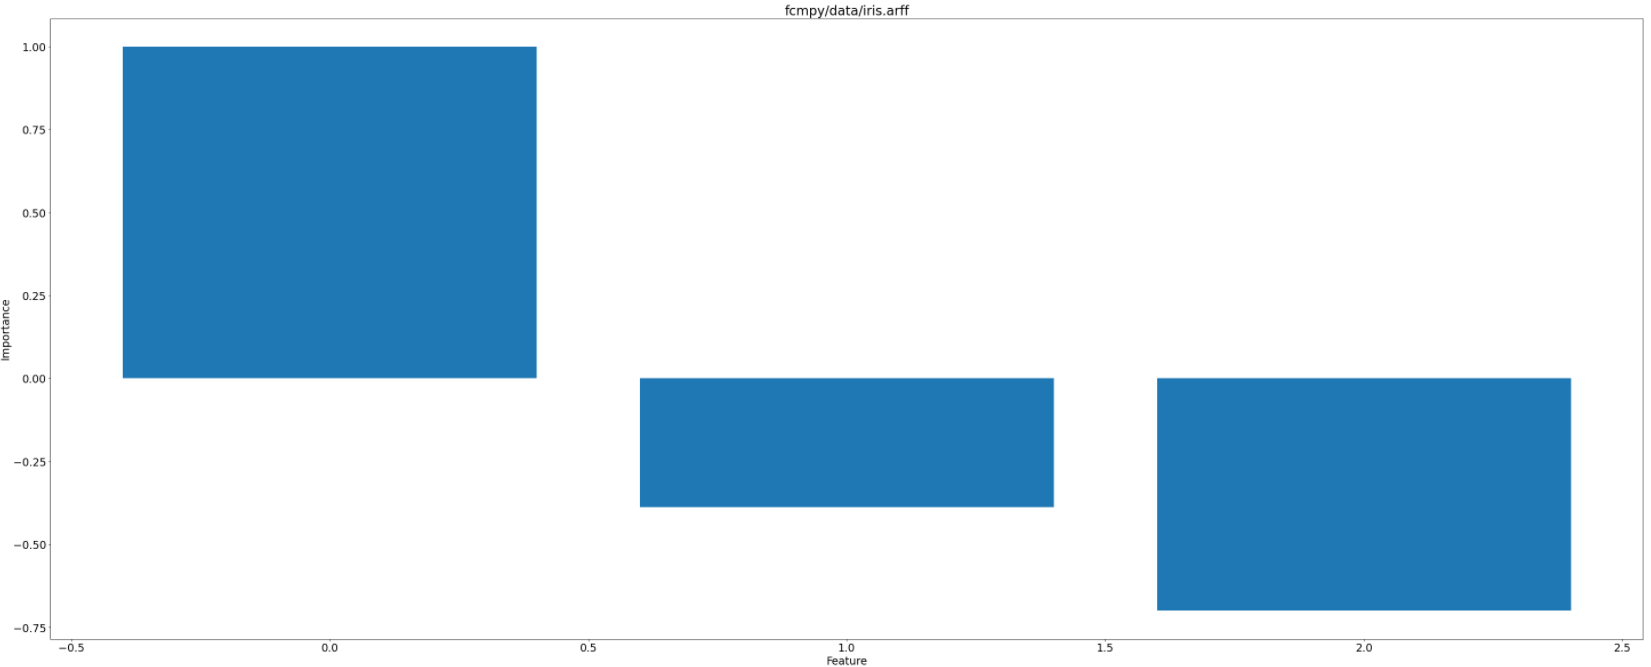
# Plotting the importance of each feature. Notice, that FCM_MP algorithm drops one of the features (the one which is the least important for the classification.
matplotlib.rcParams.update({'font.size': 19,'font.weight':'normal'})
fig, ax = plt.subplots(sharex=False, sharey=True,figsize= (10,8))
fig.get_default_bbox_extra_artists
ax.set_title(out[0]['filename'])
ax.bar(range(len(out[0]['importance'][1].flatten())),height=out[k]['importance'][1].flatten())
ax.set_xlabel('Feature')
ax.set_ylabel('Importance')